Most glaciers lead lives of constant stress, so they relax by slowly gliding on their beds. Measuring stress in solid, however, is practically impossible. What can be measured is the stress response. While civil engineers inspect buildings for cracks, glaciologists monitor the gliding, flowing, and crevassing of glaciers in order to learn about their stress levels. But wait, glacier ice is not exactly a solid. So could glacier stress be measured after all?
Freezing piezometers in Greenland
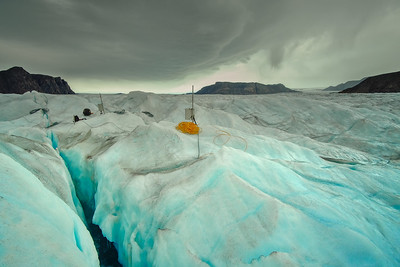
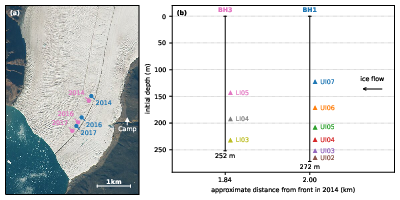
Between summers 2014 and 2017, I was part of a Swiss-Japanese team of glaciologists that deployed and maintained ice-borehole instruments on Bowdoin Glacier, a small tidewater glacier in north-western Greenland. These instruments included multi-sensor units that were lowered into the hot-water-drilled boreholes and suspended on electric cables. If this was an Alpine glacier, the instruments would remain in water. But in the Arctic, glaciers are much colder. Their temperature is below the freezing point, so that any hole, crevasse, water channel carved in the ice will eventually refreeze.

This process, however, can take up to a few months. For this reason, the units contained, among other sensors, piezometers. The piezometers were installed in order to measure water pressure on each unit, which could then be converted to a water depth, and finally the location of each unit in the water column. This would allow is to precisely locate our sensors, even if the electric cable was stretched, coiled, or if the units moved a couple of metres up and down the borehole after we left Greenland.
Back to my office in Zurich, I quickly identified this early part of the record. For the first few weeks, the piezometers remained “connected” by water so that they measured the same pressure fluctuations, corresponding to the water level in the borehole, with a constant offset, corresponding to the water height between units. From these quantities I calculated the precise depth of each unit, and discarded the rest of the pressure data as garbage. Now that each unit had become enclosed in ice, I could focusing on other measurements, such as the ice, and deformation measured by inclinometers.
An accidental discovery
Two years later, I was preparing a publication on Bowdoin Glacier’s temperature record and struggling with a different part of the processing chain. I was stuck in my analysis, had been stuck for a couple of days. So one morning, completely at lost, I decided to deactivate all the data filtering steps I had implemented so far, so that I could once again take a good look at the raw data and look for processing bugs I may have introduced along the way.
This day, I did not solve my problem. But I made another discovery.
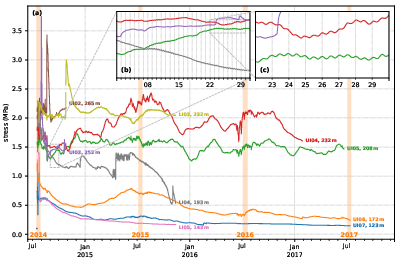
Becoming frustrated and bored, I began randomly zooming in and out on the multi-coloured curves. And suddenly, among all the noise, I hit a series of tiny, but very regular wiggles in the signal. These wiggles were part of the discarded data. There were recorded by the piezometers, or water-pressure sensors, long after all water was gone. There were ice-pressure wiggles, a direct measurement of glacier stress.

The piezometers, of course, had continued to record for the entire length of the experiment, for there is simply no easy way to turn things off on a remote glacier in Greenland, with no sunlight, and temperatures dropping into the forties. These data had been sitting on my computer all along. And up to this day, I must confess that they are still sitting here, formally unpublished. And I have tons of excuses for it (such as lack of funding, or that little fact I prefer cycling to working when I am not paid) but the real issue is, that my colleagues and I have not yet been able to fully interpret the wiggles.
Still a stressful mystery
Quickly I identified 12-hour, 24-hour and 14-day periodicities in the signal. These left no doubt on the nature of the signal, for these periods are the precise signature of tidal records in the Qaanaaq region where Bowdoin Glacier is located. Does the glacier feel the tide? Of course we know that tidewater glacier respond strongly to tides, that is why they are called tidewater glaciers after all. But our boreholes were drilled two kilometers away from the calving front. Do tidal back-pressure oscillations from ocean propagated all the way up here?

This would be fascinating, but as I dived deeper into the analysis, I had to dismiss this hypothesis. Every 12 hours, Bowdoin Glacier gently pushed on our water-pressure sensors with an incredible regularity. Every 14 days, when tides where higher, it pushed harder, and seven days later it pushed softer. But these tiny stress oscillations are anti-correlated with the tide. When tide was high, we recorded lower stresses, and when tide was high, the pressure went down. There seem to be a delay between low tide and peak stress, and this delay varies slightly from one sensor to the next.
While I hope the Bowdoin data will eventually reveal a story, we might also never fully understand what happened. Our sensors were calibrated for water pressure, not ice pressure, and it would be difficult to quantify our measurements without reproducing everything in a cold room. But as academic life goes, my contract came to an end and I moved to the next postdoc.
So could we directly measure stress in glaciers? I am not sure. But somehow I wonder whether there will be a day when we can just plug sensors in a glacier and directly measure the stress field. When I think of the recent hanging glacier collapses, or complex ice-ocean interactions that will set the pace of future sea-level rise, I imagine it would be a real game changer in field glaciology.